mineXpert2 User Manual
3 Mass Data Integrations Featured by mineXpert2
Analyzing mass spectrometric data (with or without drift data) usually involves performing various data integrations in sequence. We saw earlier that upon loading a mass spectrometry data file, the first data visualization that becomes available is the TIC chromatogram. Then, the user might ask to show the MS run data set table view (see Figure 2.4, “The table view-based scrutiny of one MS run data set”). Thus, the TIC chromatogram and the table view are both starting points for the mass spectrometric data exploration. Once a number of mass data integrations have been performed, new integrations will be available in any direction, by selecting the integration type in the plot widget (see Section 2.7.2, “The Right Column of Buttons Configures the New Integration to Run”).
Regarding the parallel execution of mass spectral integrations, please see Section 1.5.3, “Using multiple threads during mass data integrations”.
3.1 General Behaviour of Plot Widgets #
There are patterns, in the way mass spectral data integrations can be configured, that are common to all plot widgets. These common patterns are described in the next sections. First, however, the Processing Flow concept needs to be described, as it serves as the basis for the integration configurations.
3.1.1 Processing Flow Entities Document all Integrations #
Each time an integration is performed, mineXpert2 stores processing information data that allow to characterize the integration for later internal reuse. For example, any integration documents the kind of computation that needs to be performed. For example, one integration might be from TIC chromatogram to mass spectrum, another integration can be from mass spectrum to drift spectrum. These kinds of integration are documented as processing types. For each integration, there is thus a source and a destination. But this is not sufficient to document precisely the integration: there must be other informational data along with the integration type. When integrating from TIC chromatogram to mass spectrum, the user might select only a region of interest in the chromatogram. That is another kind of information that is documented: the source range (in this case a retention time range). Likewise, when integrating from a mass spectrum to a drift spectrum, the origin is a m/z range and the destination is a drift spectrum. Other data are stored in the processing information data, like the fragmentation specification—if any has been set— and the m/z integration parameters, in case the integration produces a mass spectrum.
Together, all the processing information data are stored in what is called a Processing Flow entity. A processing flow entity can contain a default MSn fragmentation specification and/or default m/z integration parameters. It can contain any number of Processing Step entities that in turn can contain any number of Processing Spec entities. Like for the processing flow, each processing step can contain a MSn fragmentation specification and/or m/z integration parameters.
How is the processing flow documented ? When a mass spectrometry data file is loaded from disk, mineXpert2 iterates in all the mass spectra of the MS run data set and computes a TIC chromatogram. That TIC chromatogram is displayed in the TIC/XIC chromatograms window. At this point, no MSn fragmentation specification is set and no m/z integration parameters are set. When the user starts exploring the data, their first integration will determine how the processing flow will be filled-in with details about that integration.
If an integration is performed from the TIC chromatogram to a mass spectrum, then m/z integration parameters will necessarily need to be used. Either the user has configured these parameters (Section 3.1.3, “Setting the m/z integration parameters”) and they will be used to perform the mass spectral combinations, or default values will be used (these default values are crafted from the statistical analysis of the whole MS run data set). The processing step that is created to document this specific integration will thus document the m/z integration parameters that have been used for the mass spectra combination. That processing step is added to the processing flow that documents the whole integration process. The plot that is created in the Mass spectra window will have, associated to it, that processing flow. Think of the Processing Flow as a pedigree ID card that each plot has associated to it. That pedigree gets incremented with new processing steps each time an integration is chained to the previous integrations.
Tip
The original feature of the Processing Flow concept is that, because each plot has its own processing flow, when a new integration is performed starting from that plot, then all the preceding steps of the processing flow are replayed and the new step is added to the processing flow. This has the beneficial effect of virtually restricting the scope of the initial data set into a much smaller data set all along the various integrations that occur during a data exploration session. When the scope reduces, the computing times reduce accordingly. However, the initial data set is not reduced in memory, only the scope of it is reduced. This is much different from other software in which mass data are effectively pruned off the initial data set with the drawback that data must be reloaded each time an integration must start from the initial data set.
3.1.2 Setting the MSn fragmentation parameters #
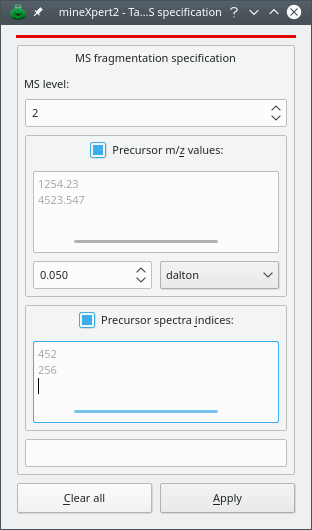
At any moment is it possible to set the MSn integration parameters by selecting the menu item from the plot widget main menu (Section 2.7.3, “The Plot Widget Main Menu”).
Figure 3.1: Setting the MSn fragmentation parameters #
The dialog window that is displayed is depicted in Figure 3.1, “Setting the MSn fragmentation parameters”. The available settings are explained below:
MS level: MS level that is targeted by the integration. For example, from a TIC chromatogram, setting MS level to 2 would perform an integration only accounting for mass spectra acquired for MS fragmentations of MS level 2, that is, for MS/MS spectra.
Precursor m/z values: SPACE or RETURN separated list of m/z values. The precursor ions' m/z values are taken into account for the integration. When iterating in the mass spectra acquired in the MS run data set, each spectrum will be checked for the existence of an ion selection list. If any of the m/z values entered in this dialog window are found, the spectrum is accounted for; otherwise it is dismissed. A precursor m/z value is the m/z value of an ion that was selected for fragmentation in a precursor spectrum acquired right before the acquisition of the fragmentation spectrum.

Warning
There is a great probability that entering m/z values in the text widget above will fail to provide any result without some value tolerance set. Indeed, the matches are performed strictly using the entered values and the values recorded by the mass spectrometer, which might have 10 decimals! It is thus necessary to enter a tolerance value for the m/z value matches. In the figure, the tolerance is set to 0.05 Dalton. Other “units” are available: resolution power and ppm.
Precursor spectra indices: SPACE or RETURN separated list of integer values. The precursor spectra indices are taken into account for the integration. When iterating in the mass spectra acquired in the MS run data set, each spectrum will be checked for the existence of precursor spectra indices. If the precursor spectra indices entered in this dialog window are found, the spectrum is accounted for; otherwise it is dismissed. A precursor spectrum index is the number of the spectrum in the MS run data set that contained an ion that was selected for further fragmentation.
Note
Note that in the dialog window above, none of the three criteria is essential. Setting the MS level to 0 disactivates that parameter as a valid criterion for filtering spectra during the integration. In this case, only MSn fragmentation specifications used in preceding integrations are taken into account (that is, fragmentation specifications present in the Processing Flow). If one wants to reset the MSn fragmentation specification to a lower MS level than that of the last preceding integration, the only way to achieve this is to go back to the previous plot where the processing flow contained processing steps of the right MSn fragmentation level values. Indeed, it is not possible to reset the MSn fragmentation level in a plot by setting the MS level to 0 because that plot already has a processing flow containing pocessing steps configured with a non modifiable MS level.
Tip
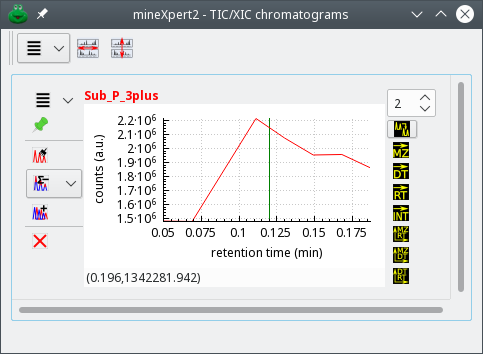
There is a shortcut to the MSn fragmentation MS level in each composite plot widget, as shown below, where the spin box widget on top of the right hand side column of allows one to set the MS level.
Figure 3.2: Shortcut to the fragmentation MS level setting #
3.1.3 Setting the m/z integration parameters #
The m/z integration parameters are only compulsorily used in case an integration will produce a mass spectrum or a color map involving m/z data in any one of the two dimensions. Indeed, these parameters are required to configure the way mass spectra are combined together into a single product mass spectrum.
An integration to a mass spectrum occurs when the user -selects a range
in a given plot while the
checkbutton is
checked. Integrations to a mass spectrum can be elicited from any plot.
The combination of thousands of spectra to yield a single combined mass spectrum is not something that can happen without tweaking the m/z integration parameters. Indeed, there ist a vast number of different mass spectral data acquisition/storage modes that depend on the vendors or on the mass spectrometer models. In general, this diversity of mass spectral data files[10] creates difficulties in the mass spectra integrations, as shown below in Figure 3.3, “Unusable combination spectrum without binning”.
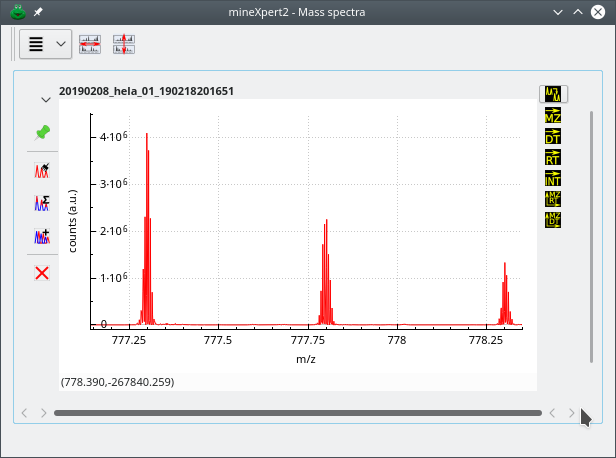
The mass data used to compute this combination spectrum originate from a Lumos Orbitrap analyzer. The visible signal should have been three peaks belonging to a 2-charged ion isotopic cluster. Each peak of the isotopic cluster is artifactually made of numerous data points because the data from the Orbitrap analyzer have 10 decimal digits. Without binning, the mass spectrum is almost unusable.
Figure 3.3: Unusable combination spectrum without binning #
In this combination mass spectrum, computed without binning from Lumos Orbitrap-originating data, three peaks that belong to an isotopic cluster appear as made of a number of “sub-peaks”. This is due to the fact that the number of decimals for the m/z values in the data file is so high that a single isotopic peak appears as a set of peaks. The signal in this mass spectrum is totally useless. This is a perfect illustration of the necessity of data binning of the m/z values of the mass spectra to be combined.
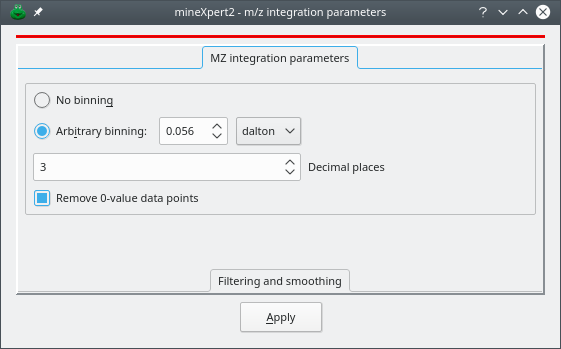
Figure 3.4: The m/z integration parameters window #
mineXpert2 provides a number of ways to configure mass spectral combinations such that the obtained mass spectrum is usable. The m/z integration parameters that might be set are described in the following sections. The window depicted in Figure 3.4, “The m/z integration parameters window” can be displayed from any plot widget menu using the menu item (see Section 2.7.3, “The Plot Widget Main Menu”). The following parameters can be set:
No binning: no binning is carried-over during the mass spectral integration. In this case, all the m/z values encountered in the mass spectra to be combined are going to be used for the combination and will be encountered in the result spectrum. This is illustrated in Figure 3.3, “Unusable combination spectrum without binning”.

Tip
There are instruments that produce perfectly binned mass spectra. In this case, using No binning is certainly the best option. For example, the files acquired from the Synapt 2 HDMS mass spectrometer sold by Waters are perfectly binned.
Arbitrary binning: binning is requested and the size of the bins might be defined using either dalton, resolution or ppm “units”.
Decimal places: when performing the combination, each m/z value needs to be restricted to that number of decimal places. This setting may in some situations improve the signal or accelerate the speed of the combination for very large datasets. To leave the decimal places as found in the mass spectrometry data file, enter the value -1.
Remove 0-value data points: remove all the (m/z,∫) pairs having a naught i value.
When all the parameters have been set, click onto Apply or key in CTRLRETURN. At this point the next integrations started from the plot widget in which these m/z integration parameters were set will be performed using the settings. These parameters will propagate to all the descendant widgets. It will be possible, at any moment and in any widget, to modify the parameters again.
3.1.4 Effects of the m/z Integration Parameters #
This section provides some examples of how the m/z integration parameters might impact the mass spectrum resulting from the combination of mass spectra. There might be situations where there is no need to set the m/z integration parameters, typically if the mass data have been properly binned by the software running the mass spectral data acquisition.
However, in a vast majority of the cases proper setting of the m/z integration parameters will be essential to achieve a combination of mass spectra resulting in a useful mass spectrum. In particular, it is important to grasp that the binning might need to be dynamically set while combining (m/z,∫) pairs along the m/z axis. This is why the two sections below show the effects of binning where the bin size unit is either Dalton (bins are of fixed-size throughout of the whole m/z range) or either res or ppm (for resolving power or part-per-million, respectively; bins have varying sizes throughout of the whole m/z range).
In the series of figures below, the same mass spectral data set was integrated to a mass spectrum using different m/z integration parameters. Also, each figure represent a highly zoomed in region of the m/z range. The first figure shows a low m/z region, the second a middle m/z range and finally, the third figure a high m/z range. The figures illustrate the shortcomings of using fixed size bins throughout the whole m/z range of the mass spectrum and the advantage that dynamic ppm- or resolving power-based bin size determination shows.
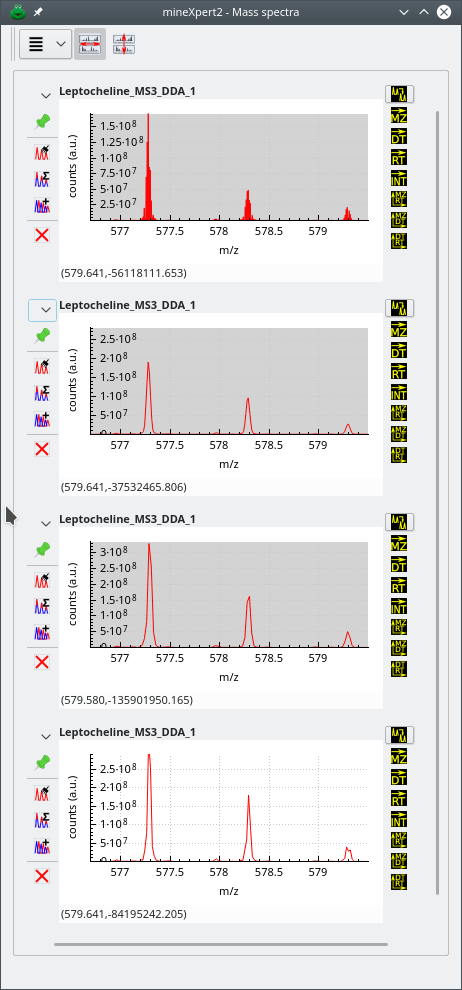
The zoomed in region of the whole m/z range is a low m/z region. The top mass spectrum corresponds to no binning, and below, from top to bottom, binning with sizes: 20 ppm, 40 ppm and 30000 of resolution power. Data from ftp://massive.ucsd.edu/MSV000084765/.
Figure 3.5: Effects of binning settings on the combination mass spectrum (low m/z region) #
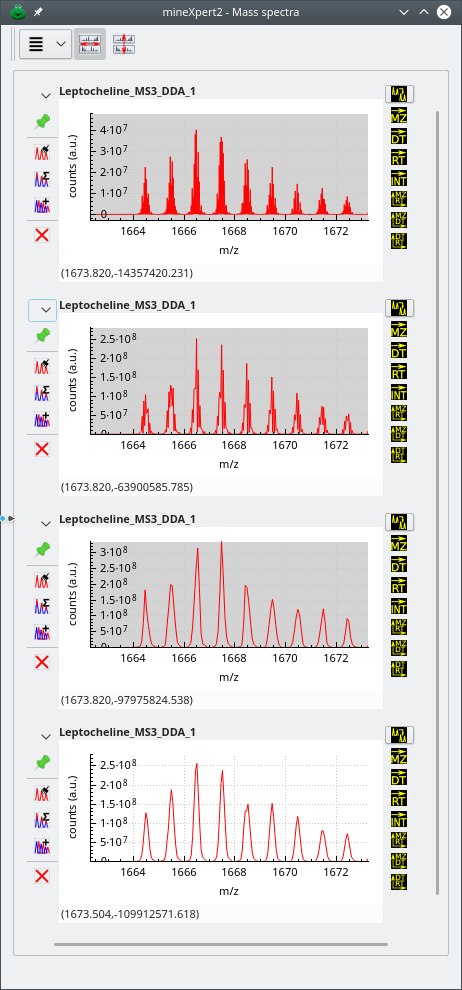
The zoomed in region of the whole m/z range is a middle m/z region. The top mass spectrum corresponds to no binning, and below, from top to bottom, binning with sizes: 20 ppm, 40 ppm and 30000 of resolution power. Data from ftp://massive.ucsd.edu/MSV000084765/.
Figure 3.6: Effects of binning settings on the combination mass spectrum (middle m/z region) #
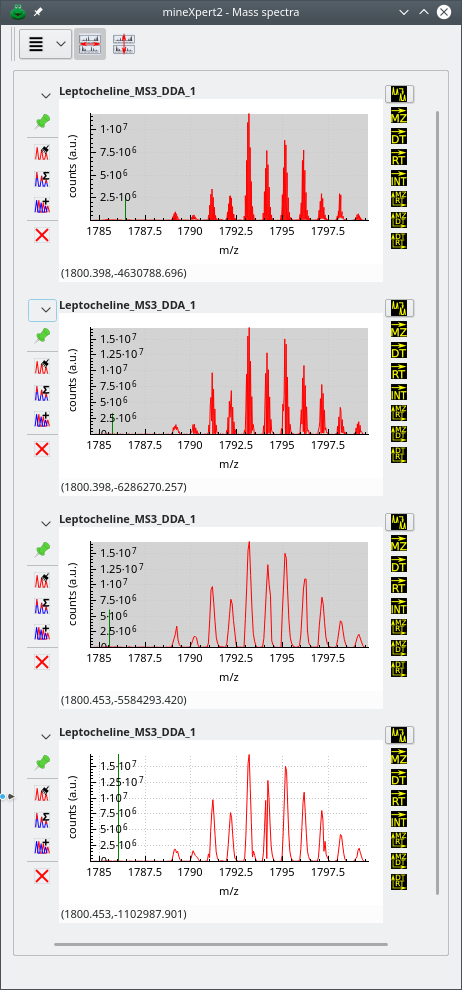
The zoomed in region of the whole m/z range is a high m/z region. The top mass spectrum corresponds to no binning, and below, from top to bottom, binning with sizes: 20 ppm, 40 ppm and 30000 of resolution power. Data from ftp://massive.ucsd.edu/MSV000084765/.
Figure 3.7: Effects of binning settings on the combination mass spectrum (high m/z region) #
The first observation that can be made by looking at the three figures above is that, for the mass spectral data set at hand, the No Binning setting does not provide a usable mass spectrum, whatever the m/z region of that spectrum's m/z range. Another interesting observation is that the effect of a given binning setting is not constant throughout the whole m/z range. For example, if we look at the second spectrum from the top, that was combined using dynamic bins of a 20 ppm width, we see that the spectrum in the low m/z region is usable, that the spectrum in the middle region is a little less usable and that the spectrum in the high region is not usable at all (too many points artifactually define a mass peak). On the contrary, the spectrum that was generated using larger bins (width of 40 ppm) looks excellent in all three regions of the m/z range. A similar (although slightly less good) result was achieved by using also dynamic size bins, but with the resolving power “unit”: 30000 resolving power “units”. Using a lesser resolving power value, like 25000 or 20000, would provide results as good as for the 40 ppm setting above.
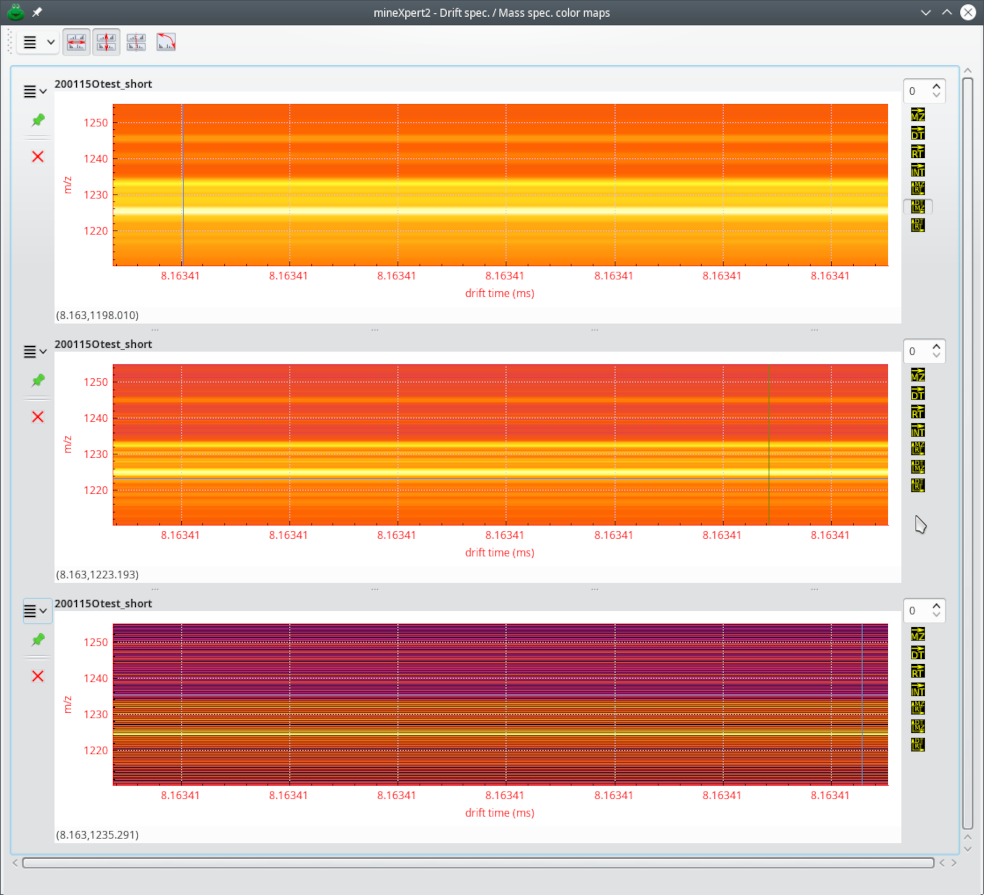
One important concept to grasp is that the bin size will actually determine the final resolution of the mass spectrum (or color map). For example, imagine that the setting is the following: Arbitrary binning with bin size of 1~Da; in that case the mass spectrum or the m/z-based color map will be very rough. Instead, setting the bin size to 0.05 will provide a much better spectrum (or color map). Of course, going down with the size of the bins will increase almost linearly the computation time required to go through them all while adding signal from the various spectra that are being combined. This is exemplified in Figure 3.8, “Effects of the bin size on the color map involving one m/z dimension”
Figure 3.8: Effects of the bin size on the color map involving one m/z dimension #
Tip
Because the computation time increases inversely with the size of the bins, it is recommended to start a color map-based data exploration session with an integration over the whole data set but with large bins (typically 1~Da) that will provide enough sight on the data. Then, when the feature of interest has been located on the color map to a given region, reduce the bin size to increase the resolution of the color map and integrate from that same color map's region to a new color map.
3.1.5 Removing 0-intensity m/z data points is useful #
Mass spectrum data points with an intensity value equal to 0 might arise either from the initial data, as read from the file, or from the binning process, as detailed below.
When bins are prepared, prior to starting a mass spectral combination operation, they all correspond to a m/z value associated to a 0-value intensity. Once the bins have been prepared, the combination starts and, while iterating through all the data points of all the spectra, fills-in the bins. If, however, a bin is never filled (it ends up never updated during the combination), that bin will have an intensity of 0. Bins having a 0-intensity value have a bad effect on the result mass spectrum. Removing them by setting the Remove 0-value data points parameter proves beneficial, as shown in Figure 3.9, “Removing 0-intensity data points”. When the 0-intensity data points are not removed (upper spectrum), the signal is deteriorated by spurious inverted spikes. Removal of the 0-intensity data points, cleans the trace perfectly.
Figure 3.9: Removing 0-intensity data points #
3.1.6 Savitzky-Golay filtering of any kind of data #
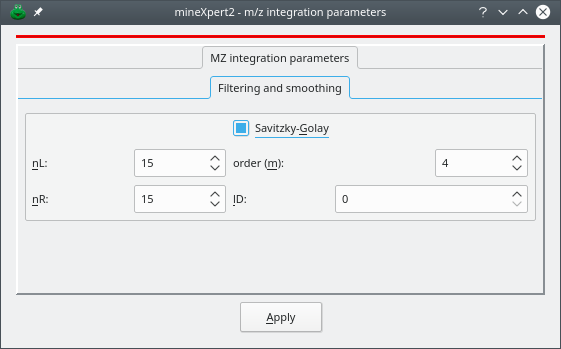
The Savitzky-Golay filtering method is widely known for its effectiveness in removing noise from mass spectral data. It is possible to apply that filter to any plot by selecting the corresponding menu as described at Figure 2.15, “Trace plot widget main menu”. The Savitzky-Golay parameters can be set by selecting the Filtering and smoothing widget as show on Figure 3.10, “Smoothing traces with the Savitzky-Golay filter”.
Figure 3.10: Smoothing traces with the Savitzky-Golay filter #
nL: specifies the number of data points to the left of the point being filtered;
nR: specifies the number of data points to the right of the point being filtered. The total number of points in the window that is considered for the regression is thus nL + nR + 1.
m: specifies the order of the polynomial to use in the regression analysis leading to the Savitzky-Golay coefficients (typically between 2 and 6);
lD: specifies the order of the derivative to extract from the Savitzky-Golay smoothing algorithm (for regular smoothing, use 0);
3.2 Various mass spectral data integrations #
Now that the configuration patterns common to all plot widgets have been described, the various mass spectral data integrations can be reviewed.
Note
All the integration operations are performed using the
right mouse mutton (). This setting allows to
easily distinguish all these integration operations from all the
-based visualization operations (Section 2.8, “General Operation of the Plot Widgets”).
Integrations to a mass spectrum This kind of operation is triggered upon
-click-dragging the mouse over the region of interest after having selected the
button on the right button column of the widget. mineXpert2 integrates all the spectra that have been acquired between the start marker and the end marker as set during the mouse drag movement. A new mass spectrum is then plotted in the Mass spectra window.
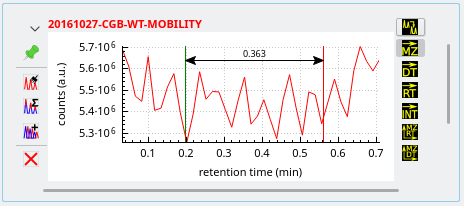
Figure 3.11: Integrating mass data from a TIC chromatogram to a mass spectrum #
As seen on the figure above, the region defined by the
-click-dragging operation is delimited by arrows, a green marker at the start and a red marker at the end. The arrows at the ends of the horizontal line allow one to make the difference between an integration selection and a simple distance-measuring selection (detailed later).
Integrations to a drift spectrum This kind of operation is similar to the one described above, unless for the
button that is now checked. The new plot is added to the Drift spectra window.
Integrations to TIC intensity This operation involves
-selecting a plot region of interest encompassing the mass spectral feature for which the intensity is to be integrated while the
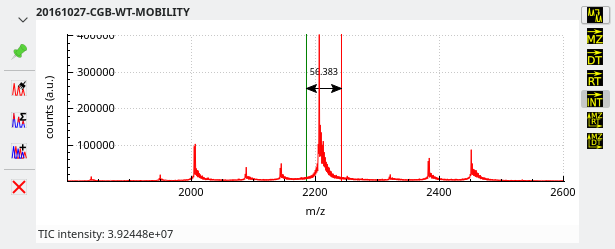
is checked. The obtained numerical result is displayed in the status bar below the plot widget and in the Console window.
Figure 3.12: Integrating mass data from a mass spectrum to a single TIC intensity value #
The same mechanics is at work in the other plot widget windows. For example, to trigger the integration of any kind of plot to an intensity = f(dt,m/z) color map, simply check the
button and drag the mouse over the plot region of interest.
3.2.1 Considerations on the Diversity of Mass Data Contents #
Loading data from mass data files in mzML format does not guarantee that the data will be of the same kind when they originate from different mass spectrometers. For example, data from Orbitrap mass spectrometers have the following characteristics:
All spectra do not start at the same m/z value;
All spectra do not have the same number of data points (they do not have the same size);
A large number of data points might have 0 values (intensity at a given m/z value is 0);
The m/z delta between two consecutive m/z values is not constant, and this is the major difficulty for data integration to a mass spectrum.
This is the output of the statistical analysis of the data loaded from a Lumos Orbitrap-originating file:
Spectral data set statistics:
Total number of spectra: 6203
Average of spectrum size: 391.311946
StdDev of spectrum size: 168.062934
Mininum m/z value: 400.007111
Average of first m/z value: 401.448935
StdDev of first m/z value: 1.590049
Maximum m/z value: 1999.928589
Average of last m/z value: 1901.852315
StdDev of last m/z value: 45.864131
Minimum m/z shift: -0.344452
Maximum m/z shift: 0.000000
Average of m/z shift: 1.097372
StdDev of m/z shift: 1.590049
Smallest Delta of m/z (step): 0.006195
Average of smallest Delta of m/z (step): 0.023757
StdDev of smallest Delta of m/z (step): 0.013179
Greatest Delta of m/z (step): 405.356934
Average of greatest Delta of m/z (step): 163.112057
StdDev of greatest Delta of m/z (step): 75.947334
As mentioned earlier, the most interesting bit of information is in the line reproduced below:
Smallest Delta of m/z (step): 0.006195
That 0.0062 value somehow gives an indication of the “definition” of the spectrum, that is, the smallest distance possible between two consecutive points in the m/z-axis.
In general, the fact that the spectra of an acquisition do not all have the same m/z vector as the m/z-axis is a great difficulty for mass spectral integration because it requires setting up binning prior to performing the mass spectral combination. That binning is nothing else than crafting a m/z value vector able to receive the intensities of all the m/z data points in the spectra to be combined. These concepts are developed in the next paragraph.
3.2.2 Statistical Analysis of Mass Data #
At the end of the data file loading, mineXpert2 performs a rudimentary statistical analysis of the data. The main datum of interest is the smallest m/z step that is observed in the whole set of mass data loaded from disk (the mass spectrum list, that can hold mass spectra in the thousands). For each mass spectrum in the list, the smallest m/z delta between any two consecutive data points is recorded. Then, the smallest ever m/z delta value is sought amidst all the recorded values. Intuitively, that smallest m/z delta value provides an idea of the resolution power of the instrument that generated the mass spectra. Interestingly, this is not the proper value to configure binning. The best value is the median value of the smallest m/z delta values encountered over all the mass spectra of the data file. It is the value that is suggested by default to arbitrarily construct the bins during an integration to a mass spectrum, as described in Figure 3.4, “The m/z integration parameters window” (Arbitrary binning value with bin size unit dalton).
3.3 Integrations Originating in Color Map Plots #
There are two different kinds of plots: the “trace plots” and the “color map plots”. TIC chromatograms, mass spectra and drift spectra are trace plots. Color map plots plot intensity values as colors for pairs of data, like mass spectra as a function of retention times or drift times, or retention times as a function of drift times.
When an integration starts from a trace plot, the integration region selection (with a right-button mouse drag operation) of a given plot range (over the X axis) can be performed without drawing a rectangle over the region of interest. Indeed, only the X axis is the criterion for the selection of the region of interest. When an integration starts from a color map plot, the second dimension (the Y axis) has a meaning for the selection of the region of interest. In color map plots, the selection region has to be bi-dimensional, that is, not a horizontal line, but a real rectangle over both the X and the Y axes.
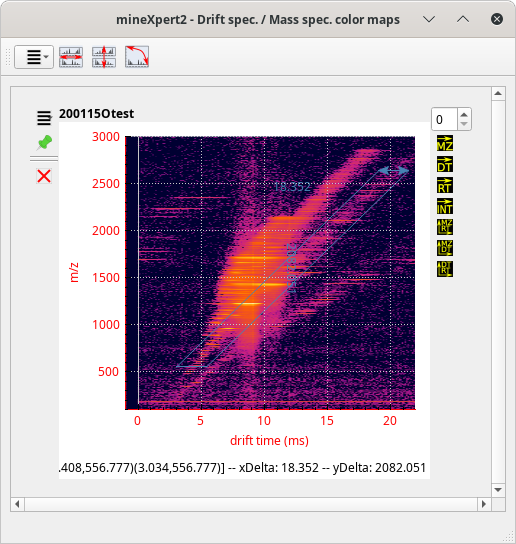
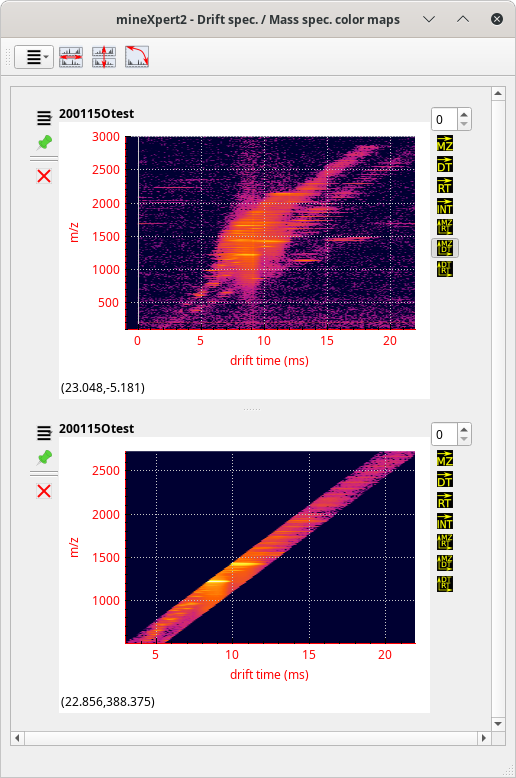
By default, the rectangle that is drawn upon mouse dragging is a real rectangle, that is, a four-square-corner polygon. There are a number of situations, however, where the user might want to select a non-rectangle region, like if the rectangle were skewed. This is illustrated in Figure 3.14, “Integrations from a color map plot using a skewed selection rectangle (last step)”
Drawing a skewed selection rectangle is a two-step process. One first draws the base of the rectangle, as usual, with a horizontal-only mouse drag movement (see Figure 3.13, “Integrations from a color map plot using a skewed selection rectangle (first step)”). When the base of the rectangle has the right width, the user presses the S keyboard key. Pressing that keyboard key triggers the definition of the width of the skewed selection rectangle, that gets stored in memory.
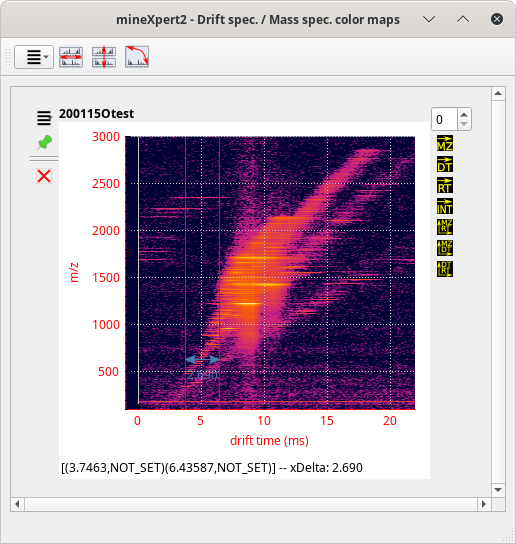
The first step in the definition of a skewed selection rectangle is to right-button-drag the mouse along the X axis in order to draw a selection line that has the final skewed rectangle width. Once the width is properly defined, the user presses the S keyboard key, which stores the rectangle width in memory.
Figure 3.13: Integrations from a color map plot using a skewed selection rectangle (first step) #
When the mouse drag operation draws the actual two-dimensional polygon (by dragging the mouse cursor also along the Y axis), the user maintains the Alt keyboard key pressed. Maintaing that key pressed has the effect of switching the drawing of a conventional four-square-corner selection rectangle into a skewed selection rectangle (see Figure 3.14, “Integrations from a color map plot using a skewed selection rectangle (last step)”).
Figure 3.14: Integrations from a color map plot using a skewed selection rectangle (last step) #
When the mouse right-button is released, the integration computation is started that involves checking if the points that are processed are indeed contained inside the skewed selection rectangle. The result is shown in Figure 3.15, “Integrations from a color map plot using a skewed selection rectangle (first step)”.
Figure 3.15: Integrations from a color map plot using a skewed selection rectangle (first step) #
3.4 Noise Reduction in Color Map Plots #
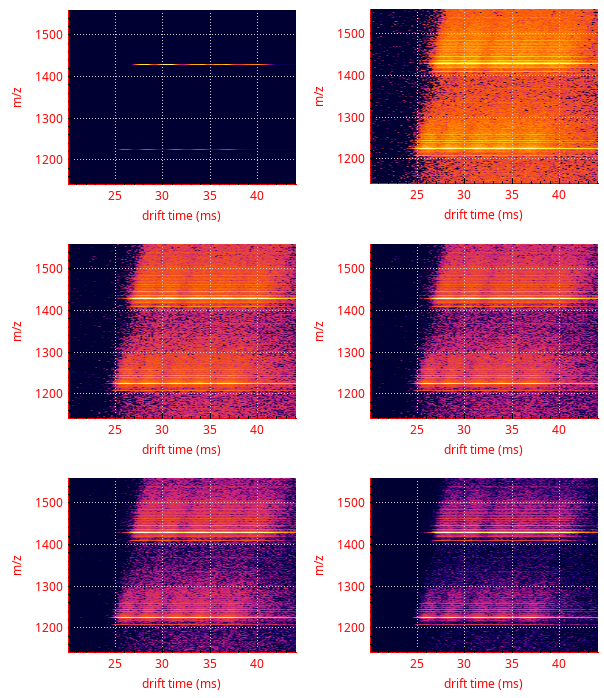
The signal obtained in ion mobility–mass spectrometry experiments may be of a very wide dynamics, which hamper proper visualization of details. One solution is to run a Z axis scale (the axis holding intensity values) conversion from linear scale to log10 scale (see Figure 2.17, “Color map plot widget main menu”). While this has the benefit of highlighting details, it also has the drawback of potently enhancing noise. As of version 8.1.0, mineXpert2 provides means to signal-to-noise ratio tweaking as detailed below.
There are two different approaches to signal-to-noise ratio enhancement:
: The value that is entered in the spin box widget is a percentage of the maximum intensity over the whole map. The function first computes a threshold using the formula threshold = percentage * max_int / 100. All the cells having an intensity value above that threshold have their value set to that threshold value. All other cells are unchanged. This function is used to reduce the dynamic range of the map and potentially enhance features of interest.
: The value that is entered in the spin box widget is a percentage of the maximum intensity over the whole map. The function first computes a threshold using the formula threshold = percentage * max_int / 100. All the cells having an intensity value below that threshold have their value set to that threshold value. All other cells are unchanged.
This function is typically used for removing noise. Indeed, by setting the percentage value to 5, for example, all the cells having a pretty low intensity value (that is, below 5 % of the maximum intensity value in the whole map data) will be set to that value. An example is provided in Figure 3.16, “Example of signal-to-noise ratio enhancement”.
The top left vignette shows the colormap as it is computed. The top right vignette show that colormap after a log10 recomputation has been performed. The remaining vignettes correspond to the application of a high pass filter with percentage values increasing from 10 to 40 in 10 % increments.
Figure 3.16: Example of signal-to-noise ratio enhancement #
3.5 Low Intensity Signal Removal in Traces #
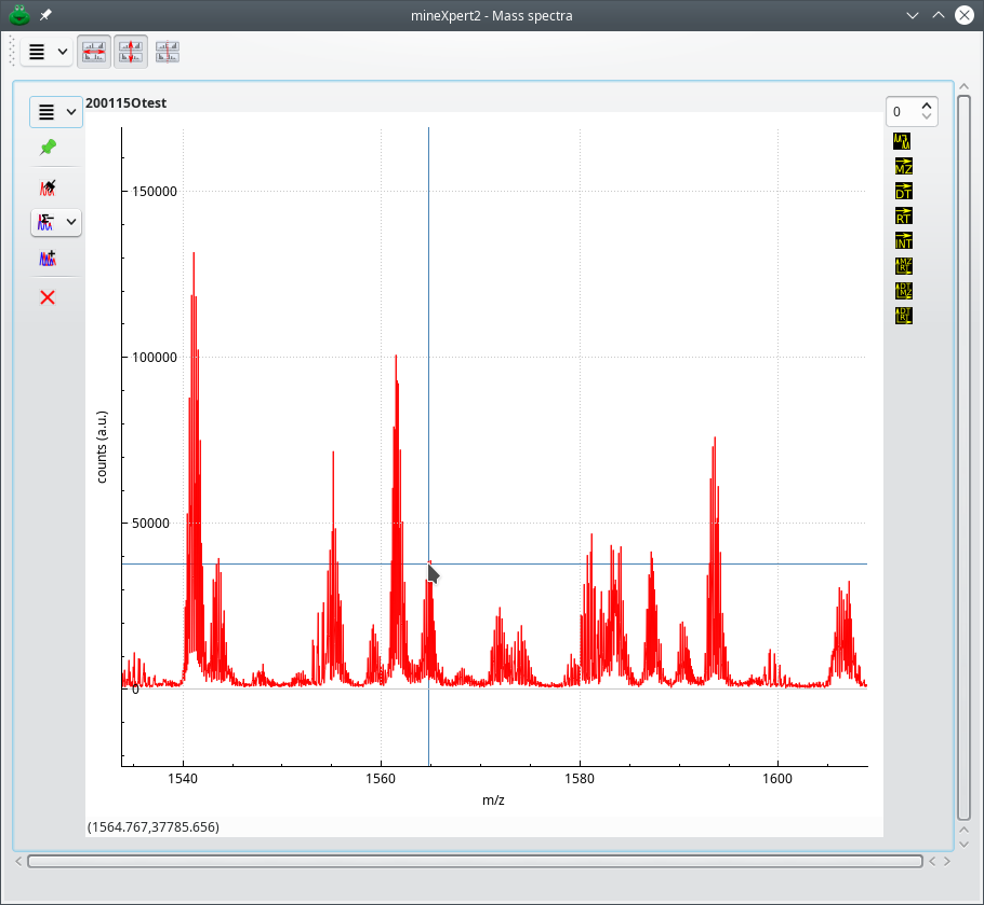
Any trace (that is, any plot that is not a color map) can be noisy. That is particularly true for mass spectra coming from non-Orbitrap analyzers. If one can tell what is the level of the noise, it is possible to remove all the peaks that are below that level. The process is complex because it needs to take into account ever-more frequent high resolution mass spectrometry data that shows resolved isotopic cluster for which certains peaks might be below the threshold while others are above threshold. Of course, if any peak of an isotopic cluster is above threshold, then the whole isotopic cluster, no matter how it might comprise below-threshold peaks, should be retained.
At the time of this writing, the low intensity signal removal filter is working best for samples containing large analytes, where the isotopic cluster is most approaching an overall Gaussian shape. It is considered that this feature is still experimental as it still has a number of rough edges. The step are described in the following figures (see Figure 3.18, “Example of low intensity signal removal (configuration)”).
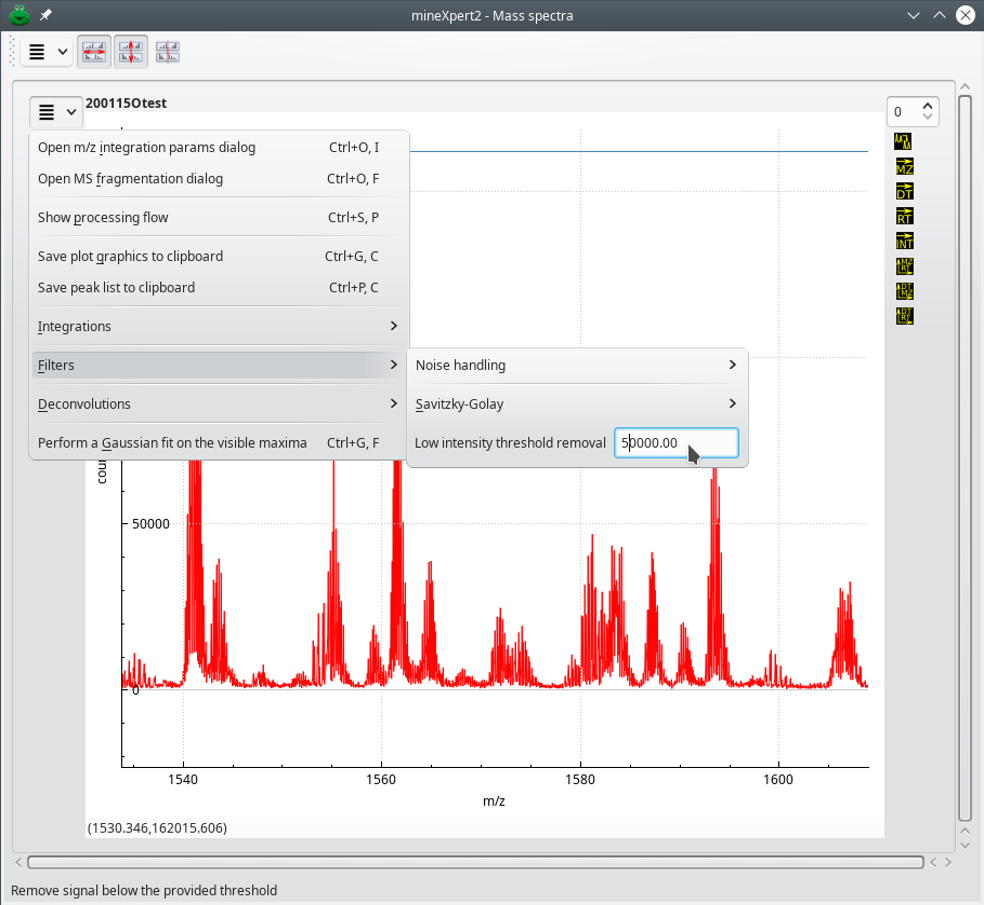
This is a segment of the initial mass spectrum with some isotopic clusters having part of their peaks above the 50000 threshold and some others that are entirely below that threshold.
Figure 3.17: Example of low intensity signal removal (starting trace) #
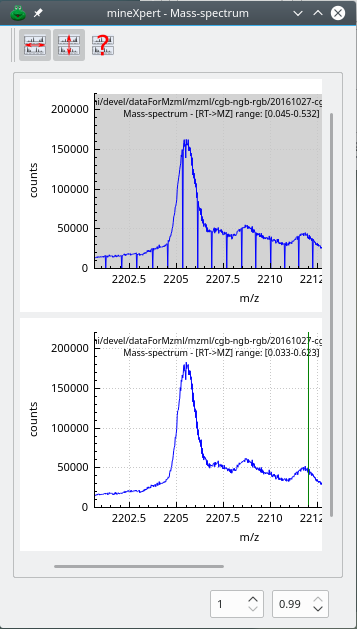
The menu item shows the Low intensity threshold removal menu item. The line edit widget allows one to enter the threshold below which signal is to be removed from the trace. Once the proper value has been entered, the user clicks the menu text. The program runs the filter and produces a new trace that is displayed along with the original trace.
Figure 3.18: Example of low intensity signal removal (configuration) #
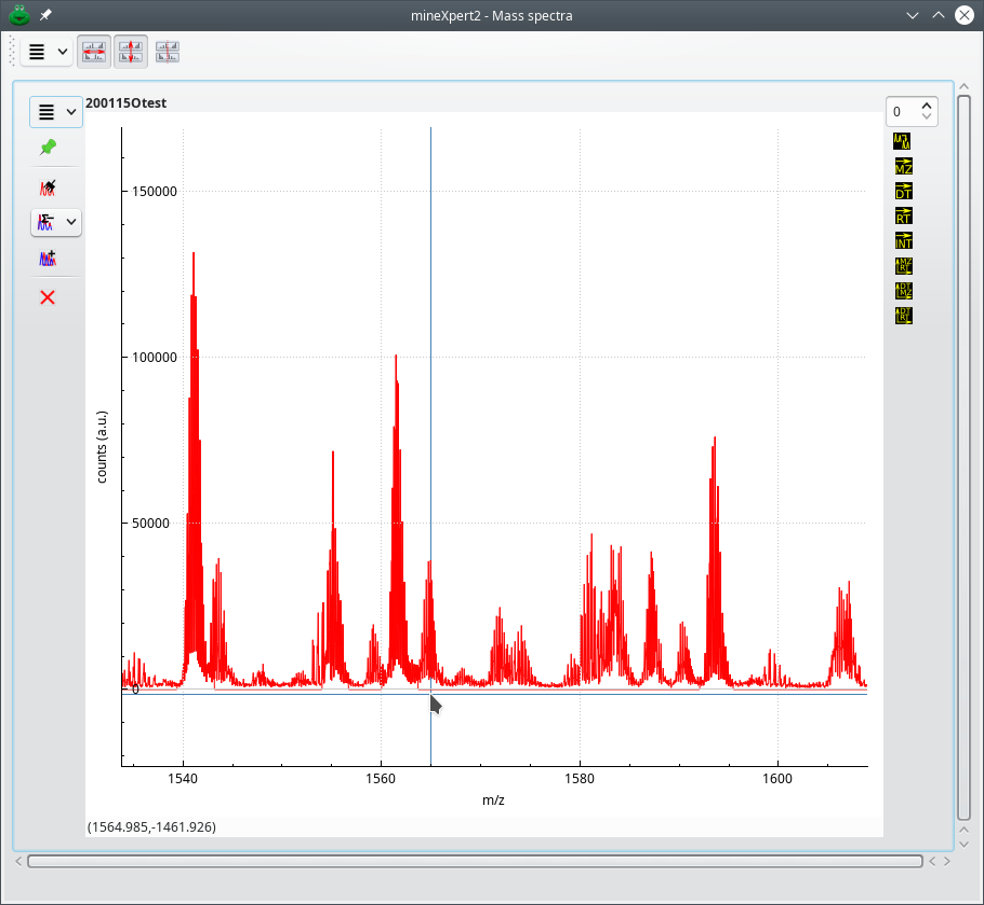
The new trace is displayed in the same composite plot widget. The user needs to zoom in enough to find it. Here, it is clearly visible at the location of the cursor near the baseline. It appears as a straight line under the mass peaks that were filtered out. In order to better visualize the new trace, select it and duplicate it using the duplication icon button at the top of the functional button on the right hand side of the composite plot widget.
Figure 3.19: Example of low intensity signal removal (creation of a new trace) #
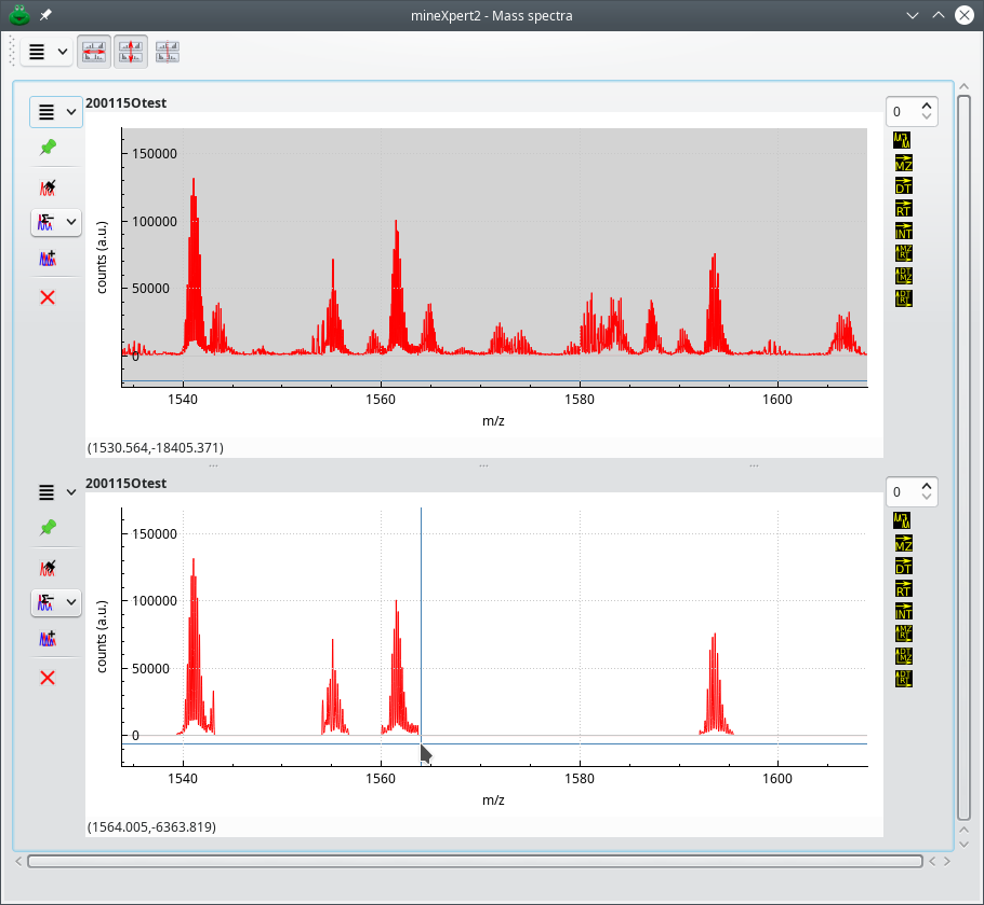
As is visible in the image, a great amount of signal present in the original mass spectrum (top plot) was removed from the trace (bottom plot). Note that the line connecting the isotopic cluster is faint where mass peaks were removed, but it is actually there. Note some remaining artifacts right after the very first isotopic cluster in the filtered trace. This is experimental work on progress.
Figure 3.20: Example of low intensity signal removal (display of the new trace) #
3.6 Chained Integrations #
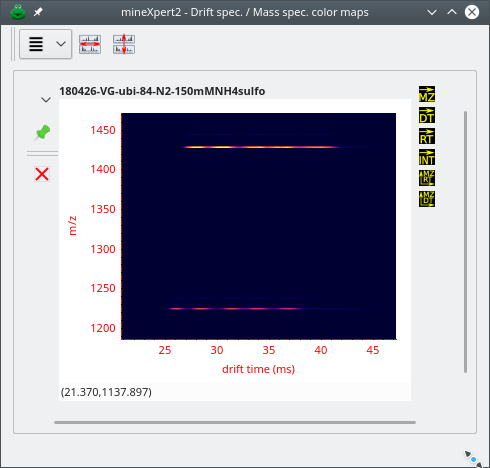
The user, in the process of exploring the data, will inevitably chain integrations to pinpoint a specific feature of interest. For example, let's say that the user is exploring ion mobility mass spectrometry data.[11] After having loaded the data file, the TIC chromatogram is computed and displayed. From there, it is possible to perform a TIC chromatogram to an intensity = f(dt,m/z) color map integration (see Figure 2.11, “The int = f(dt, m/z) color map window”.)
Figure 3.21: Example of chained integrations, color map where data exploration may start #
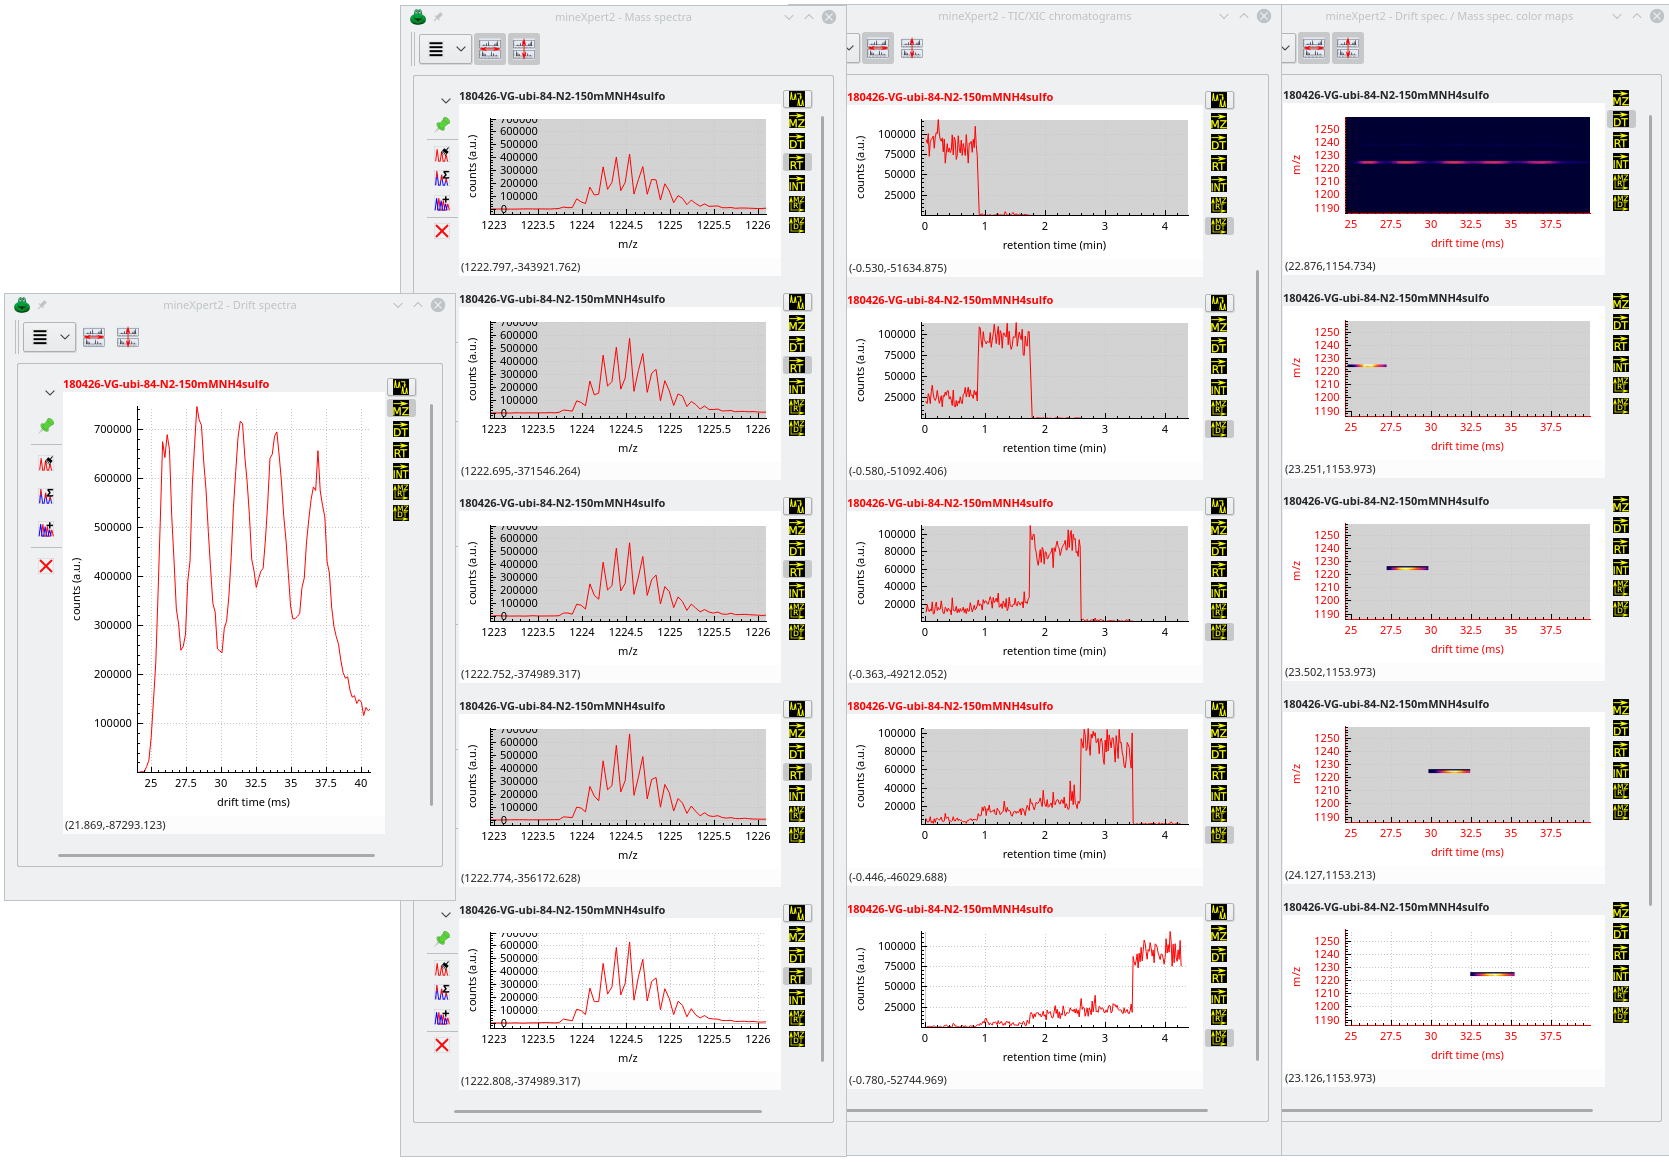
There starts the exploration. The user sees that there are a number of species having discrete drift times at the m/z ratio around 1220 (lower region of the colormap). They thus integrate to a single drift spectrum that horizontal lower region of the colormap. The obtained drift spectrum is shown at the left hand side of Figure 3.22, “Multiple chained integrations”.
Because there are five drift peaks in the drift spectrum, the user performs as many individual mass data integrations to a mass spectrum, from left to right. The obtained mass spectra are all shown in the window next to the Drift spectra window of the same figure.
Figure 3.22: Multiple chained integrations #
Most interestingly, the various drift regions are integrated to almost identical m/z values in their respective mass spectrum. In order to know when the various molecular species eluted in the chromatogram, the user performs for each mass spectrum an integration to a XIC chromatogram. The XIC chromatograms are shown on the window next to the Mass spectra window. Visibly, each molecular species was eluting from the chromatography column at discrete retention times (this was clearly not a true chromatography but instead an infusion during which instrument parameters were changed to modify the mobility properties of the ubiquitin molecule).
At this point, it is interesting to confirm that each XIC chromatogram contains exactly the molecular species that were responsible for the appearance of the purple “bands” on the int = f(dt, mz) initial color map. The different XIC chromatograms are thus integrated to a color map and the results are shown below the initial color map (less one color map that did not fit in the window). Visibly, the extracted color maps reconstitute the initial pattern visible at the top of the Drift spec / mass spec color maps window.
Note
The dataset used for Section 3.6, “Chained Integrations” was kind courtesy of Dr. Valérie Gabelica and correspond to a work entitled Optimizing Native Ion Mobility Q-TOF in Helium and Nitrogen for Very Fragile Noncovalent Structures published in JASMS with DOI: 10.1007/s13361-018-2029-4.

