massXpert2 User Manual
7 Utilities
The utilities made available in the menu of the main program window are shown in Figure 7.1, “Utilities”. These are described in detail in the following sections.
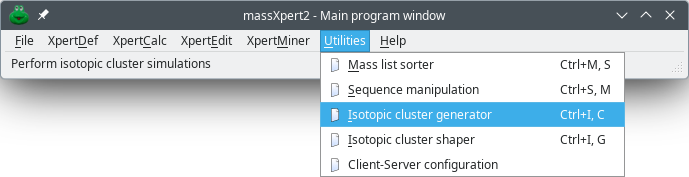
The menu provides useful features, in particular for isotopic cluster calculations on the basis of arbitrary elemental compositions and isotopic abundance distributions.
Figure 7.1: Utilities #
7.1 The isotopic cluster generator #
When the resolution of the mass spectrometer is good, zooming-in on a mass peak may reveal that a given ion has given rise not to one peak but to a set of peaks. This set of peaks is called an “isotopic cluster”.
When performing mass spectrometric data analyses, it is very often necessary to calculate the isotopic cluster of a given analyte. Indeed, the isotopic cluster can be a criterion helping to establish if a given measured signal (the acquired isotopic cluster) does indeed correspond to a given chemical entity. This requirement is becoming more and more pressing as mass spectrometers have ever-improving resolving power capabilities, thus providing the user with neatly resolved isotopic clusters even for oligomers of intermediate masses. In this section, the process of calculating the isotopic cluster of a given analyte described using its chemical composition (also called elemental composotion or formula) is described in detail.
massXpert2 provides an interface to the libIsoSpec++ library.
IsoSpec: Hyperfast Fine Structure Calculator
Mateusz K. Łącki, Michał Startek, Dirk Valkenborg, and Anna Gambin
Analytical Chemistry, 2017, 89, 3272–3277
DOI: 10.1021/acs.analchem.6b01459
This library performs high-resolution isotopic cluster calculations. In order to run the calculations, it is necessary to have the following items ready:
An elemental composition formula of the analyte (for example, H2O1). This formula needs to account for the ionization agent that is involved in the ionization of the analyte prior to its detection in the mass spectrometer.

Important
The IsoSpec software requires that all the chemical elements of a chemical formula be indexed. This means that, for water, for example, the formula should be H2O1 (notice the index 1 after the O element symbol).
A detailed isotopic configuration of all the chemical elements that are used in the elemental composition formula. massXpert2 provides different interfaces to define the isotopic characteristics of the chemical elements. These will be described in the following sections.
7.1.1 Configuration of the calculation #
Figure 7.2, “Main window of the isotopic cluster generator” shows the main view of the isotopic cluster calculator dialog window.
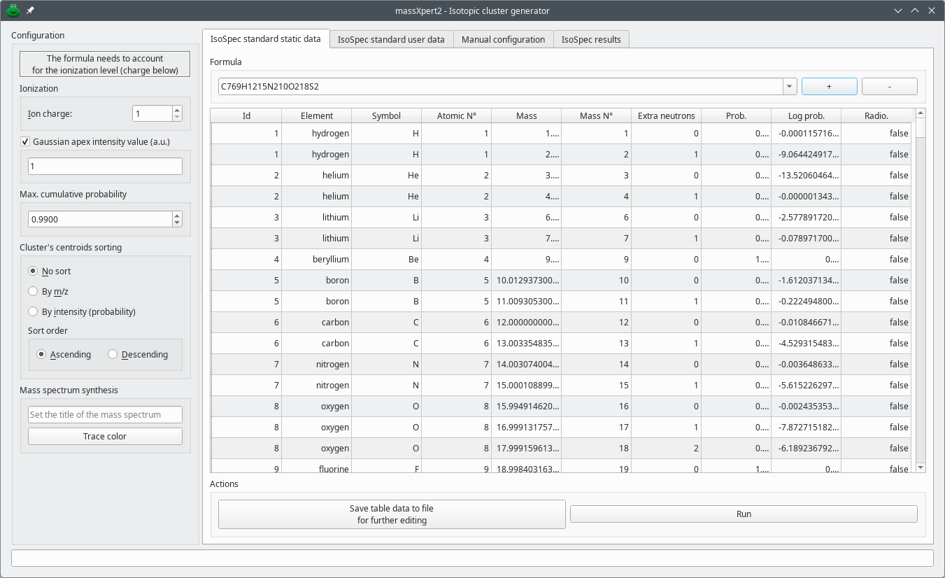
The window is divided in two parts: the left hand side part contains a number of widgets allowing one to configure the calculation and the way result data are provided to the user; the right hand side contains a set of tabs where the user may select the isotopic data to be used for the calculation.
Figure 7.2: Main window of the isotopic cluster generator #
The left hand part of the window, titled Configuration, allows one to configure the following aspects of the configuration:
Ionization: The Ion charge spin box widget allows the user to specify the charge of the ion for which the isotopic cluster is being calculated.

Warning
The IsoSpec software is “charge-agnostic” in the sense that it does not know what element in the chemical formula is responsible for the ionization of the analyte. Therefore, IsoSpec does not know anything (and does not care about) of the charge of the analyte. The ionization level of the analyte can be handled by massXpert2 if that information is set to the Ion charge spin box widget. By default, the charge state of the analyte is 1. It is important that the ionization proton(s) be accounted for in the chemical formula that is fed to the isotopic cluster calculator.
Gaussian apex intensity value (a.u.) : This is the height (that is, the intensity) of the most intense peak of the isotopic cluster. “Gaussian apex”, here, refers to the outer shape of the isotopic cluster of which the apex must be construed as the average mass of the ion.
Max. cumulative probability: This the maximum value that is accepted for the sum of the probabilities of the various peak centroids that will make the isotopic cluster. For small molecules, that value can tend to 1; for larger molecules, like proteins, that value is lower than 1.

Note
In an ideal world, one would insert the value 1 for this parameter for any computation. This would mean that the isotopic cluster calculator should account every possible isotopic combination of all the isotopes available on Earth (that is, the mass and abundance data pair for each of them) for each chemical element in the formula. For the water molecule that is feasible: there are only two chemical elements and only three atoms in the formula to be dealt with. For proteins, that would turn out unwieldy: there would be way too many combinations required to account for the huge number of atoms of the H,C,N,O,S,P chemical elements most often found in biological material.
Cluster's centroids sorting: The radio button widgets allow one to configure the way the centroids that make the isotopic cluster must be sorted prior to be reported.
Mass spectrum synthesis: The user might both specify a title for the mass spectrum that will ultimately be computed and select a color (Trace color-labelled button) for the mass spectrum trace to be plot with in case the data are to be served via the internet to a receiving mass spectrometric data exploration tool like mineXpert2.
Once the configuration above has been done, time will have come to actually define with which set of isotopes the calculation is to be performed and for which formula it should be performed. There are three ways to define the set of isotopes with which the isotopic cluster is to be computed, and these will be described in the next section.
The isotopic cluster calculation is always performed for a given elemental composition that is represented using a formula. The formula is entered in the Formula text edit widget that is found in the first two tabs in the right hand side part of the window (right above the isotopic data table view). For the third tab, the user will construct the isotopes (and the formula along the way) entirely manually.
7.1.2 The IsoSpec standard static data tab #
The data displayed in the IsoSpec standard static data define all the most common isotopes found on Earth. The values in the table view widget are “static” in the sense that they are read from the IsoSpec software's header files and they are restored to their original form each time the window is opened anew.
Note
The table comes with lots of data that we elected to retain because of their didactic value. Of course, the critical data bits are the isotope's element symbol, the element name, the mass and the probability (that is, the abundance).
The user is entitled to modify the values in the table (double-click a cell, enter a value and hit the Enter key). In this case, the only way to save the modifications is to use the Save table data to file for further editing button. It is then recommended to edit and verify the data in a text editor, save them and reopen the data in the IsoSpec standard user data tab (see below).
Warning
The modifications in the table view are lost upon closing the window.
7.1.3 The IsoSpec standard user data tab #
When the window is opened anew, the table view is empty. The user loads the isotopic data by pressing the Load isotopic data from file button. The isotopic data stored in the selected file must have been saved from the “static” tab's table view described above. The user can modify the data, that is, change the number of isotopes, their mass and/or their probability (that is, their abundance).
7.1.4 The Manual configuration tab #
The Manual configuration tab provides the last means that the user has to configure the chemical elements to be used during an isotopic cluster calculation is based on the fully manual description of the elements and of the isotopes. That configuration is performed in the Manual configuration tab of the dialog window. This method is slightly more involved than the previous one but provides also for a much greater flexibility: it allows one to create “new chemical elements” that might be required in specific labelling experiments. The manual configuration is carried over in the Manual configuration tab of the dialog, as shown in Figure 7.3, “Hand-made user configuration of the chemical elements and formula”. We will detail the configuration of a glucose labelling experiment in which a protonated glucose molecule has one stable isotope carbon atom replaced with the 14 radioactive isotope.
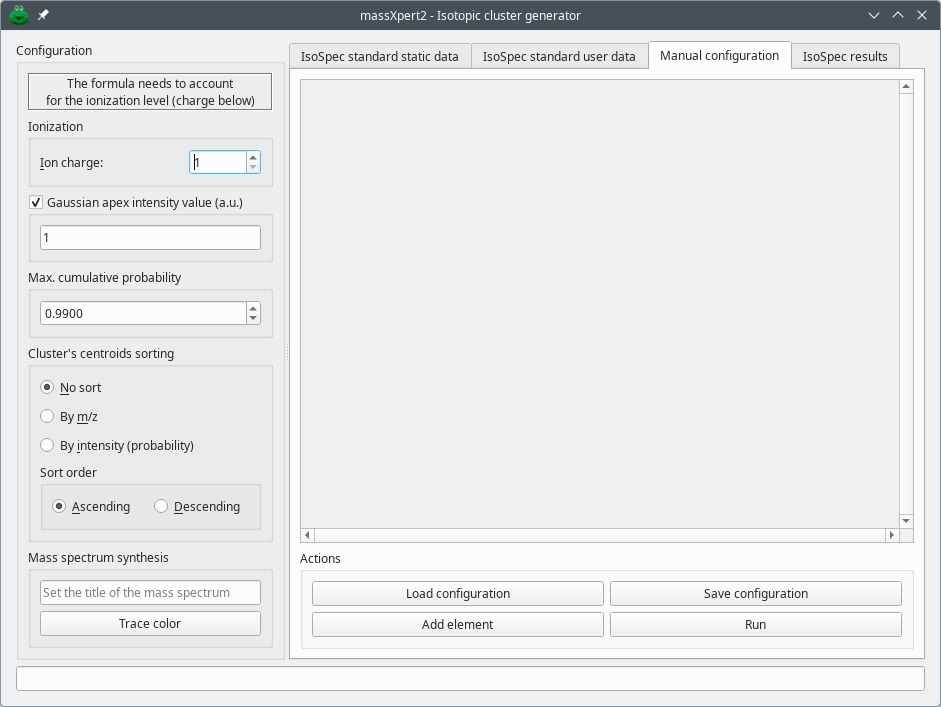
When the dialog is created, the tab is empty. To start creating element definitions, click .
Figure 7.3: Hand-made user configuration of the chemical elements and formula #
Upon creation of the dialog window, the Manual configuration tab is empty, with only two rows of buttons at the bottom of the tab. To start configuring chemical elements, click to create an “element group box” that contains a number of widgets organized in two rows:
Top row, a line edit widget to receive the chemical element symbol, C in the example;
A spin box widget in which to set the number of such atoms in the formula for which the isotopic cluster is being calculated. In the example, we set this value to 6;
A button with a “minus” image that removes all the “element group box” in one go;
The bottom row contains an “isotope frame widget” with two spin boxes for the mass of the isotope being configured (left) and its corresponding abundance (right);
In addition to the spin boxes, two buttons, with a “plus” or a “minus” figure, allow one to respectively add or remove isotope frames.
Note
It is not possible to remove all the isotope frames from an element group box, otherwise that group box would become useless.
Once an isotope frame has been filled-up, a new line might be required. To create a new isotope frame widget, click any “plus”-labelled button in any of the isotope frames. Once a new frame is created, the spin box widgets that it contains are set to 0.00000. Fill-in these spin boxes with mass and abundance and go on along this path to create as many isotopes as required.
Once all the isotopes for a given chemical element have been defined, a new element might be needed. For this, click and start the configuration of the new element as described above.
The manual isotopic configuration of the chemical elements required to perform an isotopic cluster calculation for a given formula is tedious. The user may want to save a given configuration to a file (click Save configuration) so that it is easier to recreate automatically all the widgets upon loading of that saved configuration (click Load configuration).
The final configuration is shown in Figure 7.4, “Typical manual configuration of the isotopic characteristics of the chemical elements”. The experiment that was configured above is a labelling of a glucose molecule with Cz, an imaginary chemical element that is like carbon but that has a [14C]. The glucose molecule (normal formula: C6H12O6) is labelled on one single carbon atom with an efficieny of 95 %. This means that, when the labelling fails (in 5 % of the cases) the carbon atom has its isotopes with usual probabilities (compounded by the fact that the normal atom is found at that position only in 5 % of the cases). The isotopic abundances for the Cz element are thus:
For [12C]: 0.05 * normal [12C] abundance;
For [13C]: 0.05 * normal [13C] abundance;
For [14C]: 0.95;
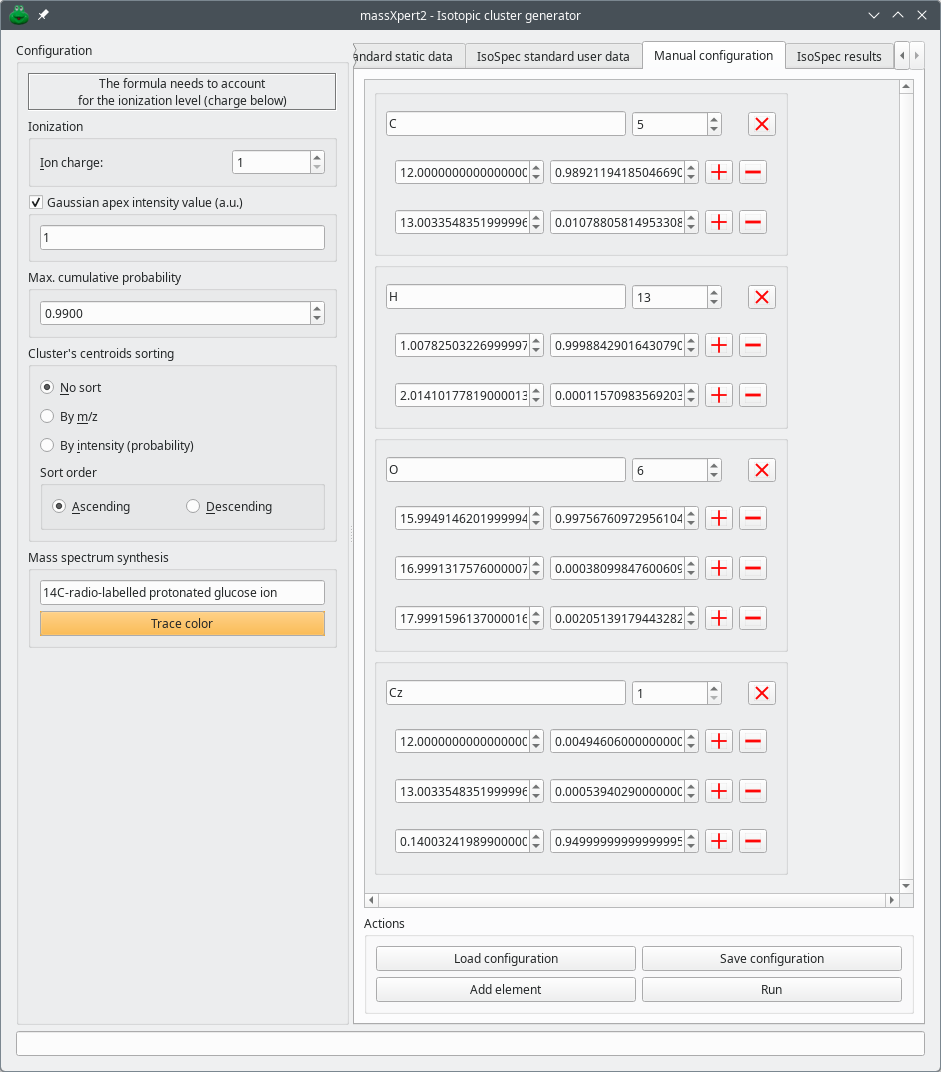
The user has configured a labelling experiment where the glucose molecule is labelled at a single carbon position with a [14C] atom (the efficiency of the labelling is 95 %).
Figure 7.4: Typical manual configuration of the isotopic characteristics of the chemical elements #
Note
Note that the “normal” carbon count is 5 (and not 6), that the hydrogen count is 13 (and not 12, because the glucose is protonated) and the labelled carbon is present only once.
Now that the isotopic data have been configured thoroughly, the isotopic cluster calculation is triggered by clicking the Run button. When the isotopic cluster generator has finished the computation, the dialog window switches to the IsoSpec results tab and displays all the peak centroids that collectively make the isotopic cluster in the edit widget, as shown for the radiolabelled glucose ion in ???.
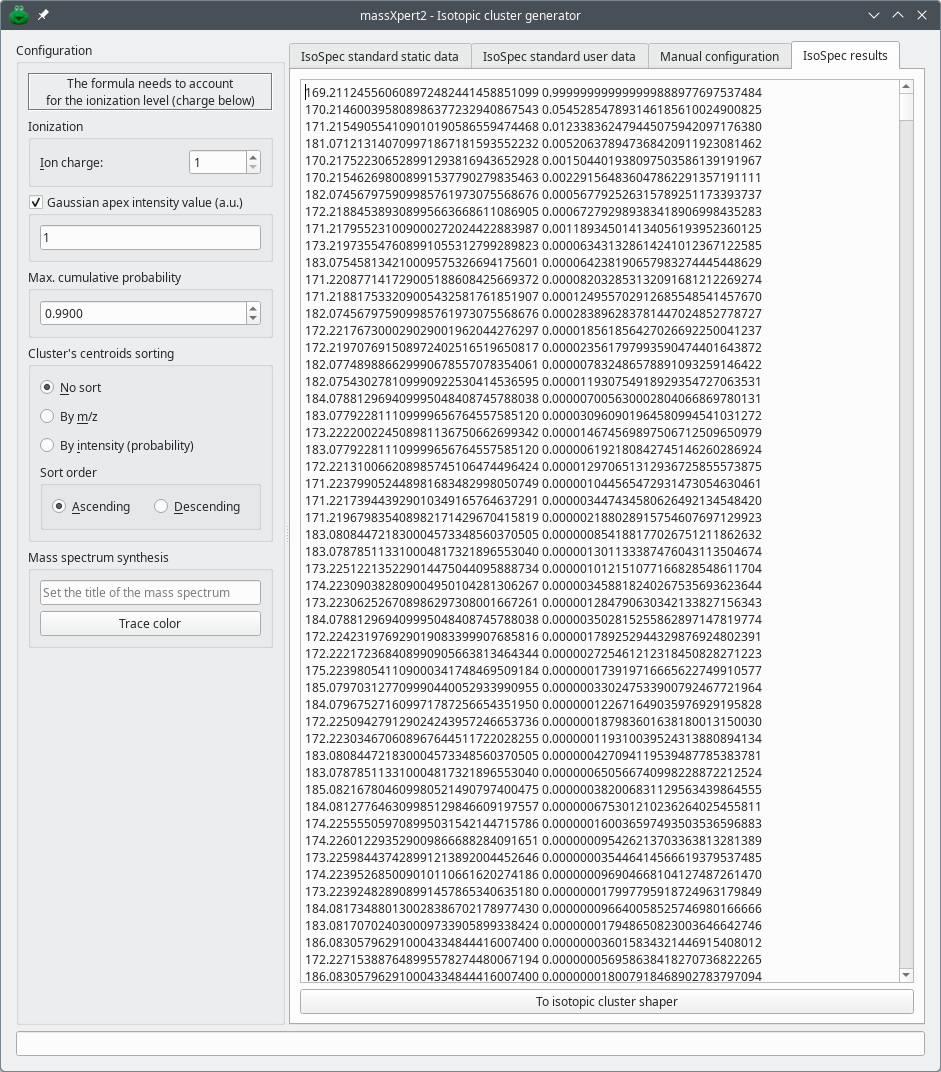
The peak centroids that collectively make the isotopic cluster of monoprotonated singly-labelled 14C glucose ion are displayed in the IsoSpec results tab.
Figure 7.5: Typical manual configuration of the isotopic characteristics of the chemical elements #
The results that are produced by IsoSpec represent the peak centroids of the isotopic cluster. The results are thus a set of (m/z,∫) pairs that have not the characteristic shape (the profile) that is found in mass spectra. massXpert2 features the ability to give a shape to the centroid peaks. For that, click the To isotopic cluster shaper button, which opens a dialog window preloaded with the IsoSpec-generated peak centroids. The workings of this peak shaping feature is described in Section 7.2, “Shaping a centroids-based isotopic cluster into a well-profiled cluster”.
7.2 Shaping a centroids-based isotopic cluster into a well-profiled cluster #
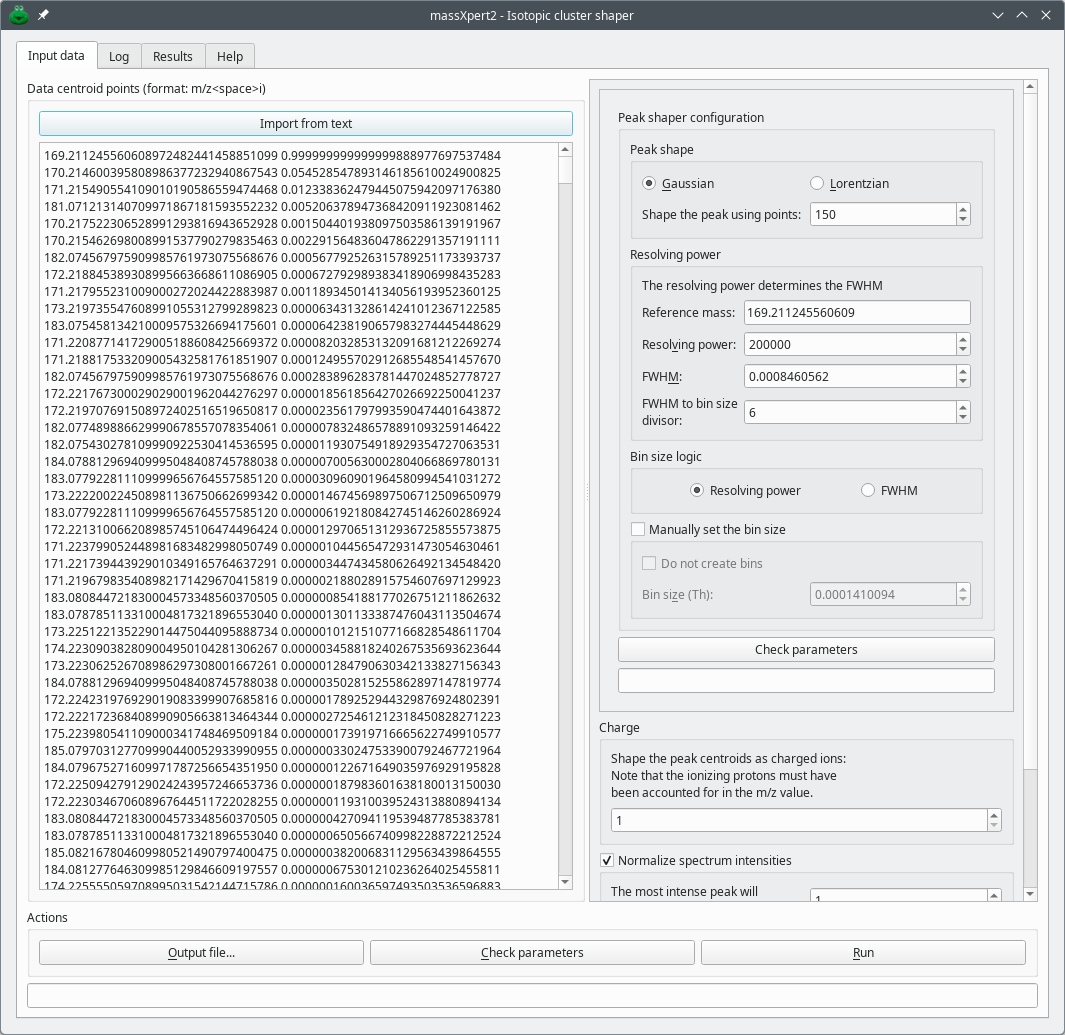
The shape of mass peaks is typically Gaussian or Lorentzian (or a mix thereof). There are some data simulation or analysis processes that lead to having mass peaks characterized by a single centroid m/z value and a corresponding intensity. Plotted to a graph, a centroid mass peak yields a bar. In order to convert mass peak centroids into something that resembles a real “profile” mass peaks, a mathematical formula can be applied, with some parameters to configure the shapes generated. mineXpert2 includes that feature, accessible via the → menu item. The window that opens up is shown in Figure 7.6, “Setting-up of the centroid mass peak shaping process”
This dialog window allows one to configure the shaping of mass centroid peaks. Setting a spectrum name in the Mass spectrum synthesis line edit widget will help recognize the result mass spectrum once displayed (see below). The color in which the mass spectrum is later to be plotted can be selected also (here, the orange color).
Figure 7.6: Setting-up of the centroid mass peak shaping process #
The cluster centroid peaks are listed in the Data centroid points (format: m/z<space>i) text edit widget. When this dialog window is opened by the isotopic cluster generator dialog window described above, the results from that calculation are automatically pasted in this editor widget.
Note
In case the user wants to generate a shaped isotopic cluster starting from text-based peak centroids coming from outside of massXpert2, the text is to be pasted in this edit widget and then the data must be made available internally to the shaper by clicking onto the Import from text button.
The various bits of configuration required for fully characterizing the mass peak shape for the cluster are described below.
Peak shape: Select the peak shape that is desired for shaping each single centroid peak. The number of points used to shape the peak is specified in the Shape the peak using points spin box widget.
Resolving power: This group box widget contains all the widgets that allow configuring the peak width at half maximum (FWHM) that characterizes the resolution of the final mass spectrum. The ultimate value used by the peak shape-computing algorithm is the FWHM value. There are two ways to obtain that value: either by setting that value manually in the FWHM spin box widget or by setting first the Reference mass value and then setting the Resolving power value; when the editing of that latter value is finished, the FWHM value is computed automatically and presented in the corresponding spin box widget.
Note
Although the FWHM value is computed using the resolving power and the reference mass, the peak shaping occurs using the m/z value of each peak centroid individually. This means that the mass reference value is only indicative for the user to actually see the FWHM value as computed from the resolving power.
FWHM to bin size divisor This divisor is applied when the final size of the bins is computed. The FWHM inserted (or computed and shown) in the FWHM spin box widget is divided by this value to give the bin size as displayed in the Bin size (Th) spin box widget. This value is typically set to 6, which empirically provides good results in terms of peak shape (this roughly means that it is necessary to have 6 m/z slots to properly shape a peak centroid) during the combination of all the shaped peak centroids into a single mass spectrum.
Bin size logic: If the Manually set the bin size checkbox is checked, the radio button indicates what logic presides at the definition of the FWHM value: either it was set manually (FWHM is set) or it was computed starting from the reference mass and the resolving power (Resolving power is set). This bin size logic feedback only makes sense if the user wishes that a bin size be computed.
Note
Binning might reveal essential when computing complex isotopic clusters. It is possible to set a bin size value manually or to let the program compute that size on the basis of the parameters entered above.
Manually set the bin size This checkbox allows the user to either switch off the computation of the bins (Do not create bins check box checked) or to enter the bin size in the Bin size (Th) spin box widget.
Check parameters Clicking this button check the consistence of all the parameters above. If the parameters validate, then it is possible to run the computation.
Charge Ionization level of the ion for which the isotopic cluster is to be shaped.
Warning
If the cluster's peak centroids have been computed in the isotopic cluster generator described above, the user might have specified a charge already. In this case, the peak centroids have already been computed for that charge. Do not set the charge again, otherwise the charge is going to be accounted for once more (from a twice-charge ions one would en up with a four-times-charged ion).
Normalize spectrum intensities If this checkbox widget is checked, the user can enter a value that will be used to normalize the final shaped isotopic cluster: the most intense peak will thus have the intensity set in this widget.
Mass spectrum synthesis This group box holds two widgets that allows the user to both provide a title for the mass spectrum and define a color with which the mass spectrum is to be plotted. This feature make sense only if the mass spectrum is to be served to a client via the internet server (see below).
Once the configuration of the shaper is done, the user clicks the Run button. The shaper computes the mass spectrum resulting from the combination (binned or not) of all the single shapes obtained for each single peak centroid that makes the isotopic cluster. When the mass spectrum is ready, the dialog window interface switches to the Results tab and the mass spectral data are displayed in the edit widget.
The Results tab holds , as shown in Figure 7.7, “Shaped peaks mass spectral data”.
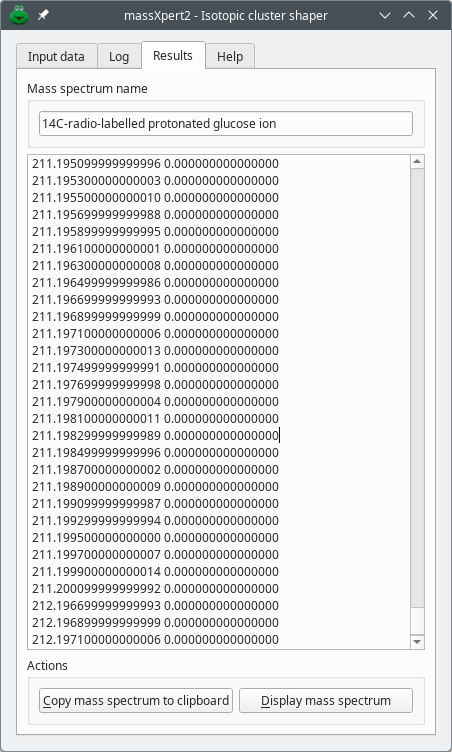
The mass spectral data corresponding to the combination of each individual “peak-shaped” centroid peak are displayed in this tab. Plotting these data will produce a nicely shaped isotopic cluster matching what would be seen by recording a mass spectrum on an instrument.
Figure 7.7: Shaped peaks mass spectral data #
The mass spectrum can be copied to the clibpoard, either to store it in a file or to plot it in another program, like mineXpert2. If the user has started the FTP server in massXpert2 and started the FTP client in mineXpert2, then, clicking Display mass spectrum will plot the mass spectrum in mineXpert2 using the mass spectrum name and the plotting color (if defined).
See Section 7.3, “Configuration of the network-based communications between massXpert2 and mineXpert2 ” for the configuration of the network-based communications between massXpert2 and mineXpert2.
7.3 Configuration of the network-based communications between massXpert2 and mineXpert2 #
The two programs of the msXpertSuite software suite, massXpert2 and mineXpert2 can exchange data via the network provided that both are set up for FTP-based communications. In massXpert2, the configuration of these communications is performed by using the → menu item. The configuration is performed in the dialog window shown in Figure 7.8, “Setting-up of the centroid mass peak shaping process”.
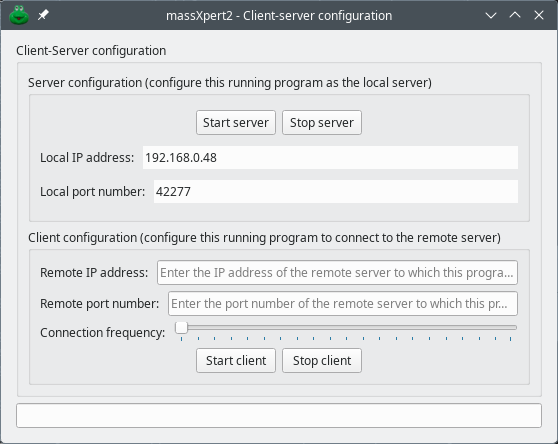
This dialog window allows one to configure the FTP-based communications between the two software pieces of the msXpertSuite software suite: massXpert2 and mineXpert2.
Figure 7.8: Setting-up of the centroid mass peak shaping process #
To start the server, click the Start server button and the IP address and port number will be displayed. To start the client, insert the IP address and port number in the Client configuration group box and click Start client. It is possible to set a frequency with which the client requests new data on the connection.